2d Contour Plot
Advertisement
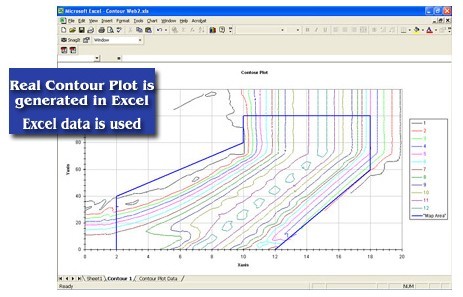

Contour Plot for Excel v.1.01
Create real contour plots in Excel using any data (rectangular, nearly rectangular, or irregular data).
Wafermap v.3 2
WAFERMAP is an award winning software package used to collect, edit, analyze and visualize measured physical parameters on semiconductor wafers.

Visual Data v.3.6.0
Scientific data visualization software. Creating vertex, grid and surface model, color map, contour plot, vector plot, 4D scatter, 4D slice and 4D vector.

Visual Data For Academic v.3.2.0
Scientific data visualization software. Creating vertex, grid and surface model, color map, contour plot, vector plot, 4D scatter, 4D slice and 4D vector.
3DField v.3.7.3
This plotting software converts your data into contour maps and surface plots. It interpolates X, Y and Z data points onto a grid, orthogonally or within an arbitrary border. It also displays data points on a plane,
3DFieldPro v.2.9.2
Create contour maps. 3DField is a contouring surface plotting and 3D data software that runs under Microsoft Windows NT/XP/Vista/7. 3DField converts your data into contour maps and surface plots.
CsXGraph
ActiveX/OCX control to draw 2D pie charts, bar charts and line graphs. As well as displaying the graphs they can be exported to file in gif, png, bmp, jpg or pcx format. Output can be exported as binary data for use with web applications, or copied to the

Visual Calculus v.3.9.2
Visual Calculus is an easy-to-use calculus grapher for Graphing limit, derivative function, integral, 3D vector, series, ode etc. Which can create 2D, 2.5D and 3D function graphs, animations and table graphs.
EZplot v.1 1
EZplot is an Excel add-in and trademark of Office Expander. The software design is targeted to improve productivity in creating Excel plots and performing data calculations in Microsoft Excel (from the Microsoft Office Suite).